Innovation Session: The History of NFL Win Percentages – Part 5
Tonight I changed my approach, at the advice of Sean Conaty, and decided to turn the CSVs into JSON using a separate python script that I would then load into D3 to visualize. I am much better at manipulating data in python, so this approach should help eliminate some of the frustration I faced last week trying to get the CSVs to load properly.
Separating the way the data is stored from the format it is accessed in will let us take advantage of the best aspects of each. This is how many internal APIs work. I would consider this more of a hacked API as the script runs locally and I will only run it when I update the CSV.
Overall it seemed to work pretty well. I am now looping over the correct teams and have the data in a usable format.
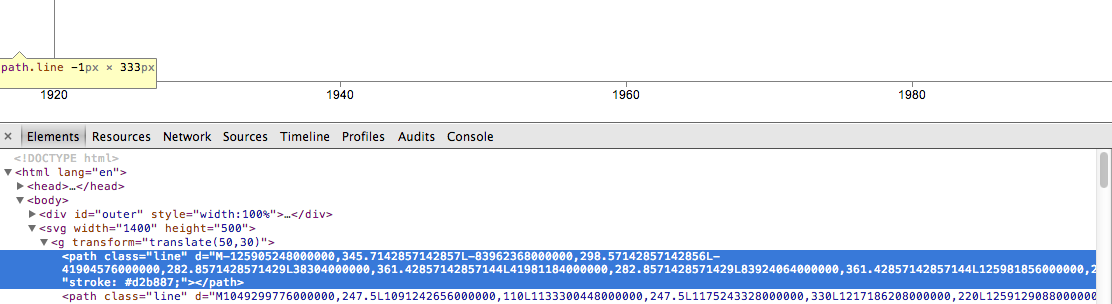
The on thing holding me up is that the lines aren’t appearing. I can see them in the code but the path must not be correct as they aren’t rendering in the frame. It looks like most have a width of negative one, which is confusing. Hopefully I can figure that out soon.
The good news is that once they show up, the colors will be correct and it should be pretty easy to start manipulating the interaction.