The Bike Counter
My Bike Commute
For the past five years, I’ve commuted to work primarily by bike. I find it to posses the positive attributes of being healthy, flexible, and consistent – while also avoiding the negative attributes of being stressful, costly and polluting. In many ways it is the perfect opposite to the dreaded car commute.
Biking was a constant for me the entire time I lived in San Francisco. Many parts of my life changed, but my 20 minutes to unplug as I pedaled through the streets of the city was something I could depend on. It was how ramped up my energy to prepare for the day and it also served as a buffer to help me unwind at the end of the day.
That all began to change when I moved north to Seattle last August.
The distance between my house and office was over twice as far as it had been previously – significantly increasing the time and effort required to bike. As fall set in, Seattle’s famous rain started to pour and I had to learn to deal with conditions I hadn’t seen much of during the long drought in California. Winter eventually came. The shorter days brought morning temperatures that would often remain in the 40s, sometimes the 30s.
I love biking, but there were days where the cold, rain, dark or wind were just too much for me. Some days it is all four at once. There were mornings where I would look outside and just not have it in me to get on the saddle.
I hold the opinion that challenges make you stronger but sometimes you need a little help to rise to the challenge. For me help came in an unusual and unintentional form – a six foot tall black metal pillar with a few neon green LEDs.
My New Bike Commute
West Seattle, where I live, is separated from downtown Seattle by Elliot Bay, a beautiful vibrant blue body of water. As you watch it you will see the water taxi carrying commuters across and perhaps hear the faint sound of sea lions barking from a nearby floating dock. The south end of the bay is home to a shipping port that ranks 30th in the US by dollars transported – not that you could tell by looking at it – it doesn’t seem very busy at all.
As you follow the shore around you will run into where the Duwamish River empties into the bay. An estuary that remains polluted despite cleanup efforts over the last decade.
There are two brides over the Duwamish River. The one you will most likely use if you ever visit is the West Seattle bridge, a large six-lane highway bridge that rises 140ft above the water. It was built after a freighter hit the old drawbridge in 1978 – something the locals are still upset about. Shortly after the large bridge was built, a smaller, though more architecturally impressive, bridge was built just next to it. The Spokane Street Bridge has two sections that rotate to create an opening that allows boats to pass.
Despite its small size, I like the lower bridge the most because it has a dedicated two-way bike section separated from cars by a concrete wall. That is the ideal situation to bike in and it was very thoughtful of the designers to put it in.
In fact, this bridge is the only way to get over the river by human power. All bike paths from the West Seattle area convene there, which is why the city of Seattle targeted that place for a bike related project they started in 2014. The same project that resulted in those neon green lights that serve as my motivational help on rainy days.
The Bike Counter
Like most cities, the City of Seattle has realized the importance of decreasing dependency on the horribly inefficient car. In order to support the growth they will experience over the next decades they will have to increase the use of more efficient modes of transport. They have, as most wise people do, realized that bike transportation is one great alternative.
In order to increase the commuting that happens by bike, the city is undertaking efforts to become more bike friendly: designating more bike lanes, building barriers between cars, closing some roads to cars completely, etc. They want to measure the effectiveness of these efforts over time, so they created a feedback loop in the form of bike counters that live in a few strategic places. The Spokane Street Bridge being one of them.
The counter itself is a six foot tall black metal pillar with a tiny bit of white writing describing the purpose and a few LED lights. Across the body of the pillar, on either side, there is a bar that counts up to one million with LED lights filling in the portion to represent to total bike traffic for the year. Above that, also on either side, is a numeric display that shows the total for that day as a digital number.
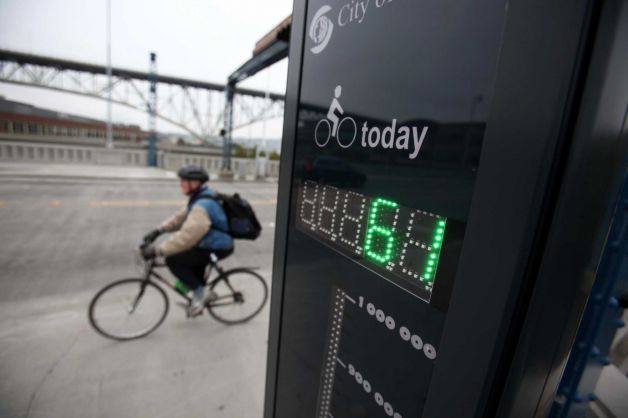
As you bike past the counter, a laser at ankle height is triggered an inductive loop buried in the ground detects the metal of the bicycle wheels and the counter increments by one. (Thank you to Eco-Counter, the company the manufactures the device for reading this post, correcting me and sharing it) The data are then transmitted back to a central repository and made available to investigate. The city has a website that shows some basic visualizations and other people have used the data to make even cooler visualizations, like this one.
You can’t see those visualizations when you’re biking, but if you turn your head to check after you pass, you will see the number change. That is your number for the day – your tick on the board. At least until you return that evening and are counted again.
That subtle decision to include the number, to let me see myself get counted, is a crucial part of this story. They didn’t have to do that. They could have installed the counter and transmitted the data and never had an LED light. They could have been subtle like the laser counter on city buses or secretive, like the employee working the clicker counter on the ferris wheel. But they were neither, the put your number up there in big green text that you can not avoid seeing.
My Number
As happens with numbers, after a few days I began to notice a pattern. When I went to work I would be in the 500 range and when I came home I would be in the low thousands. I started to wonder how many people that had biked in before me had also returned before me. How did those numbers add up? Was it that I worked on a later schedule than everyone or were there lots of people that started work even later than I did?
I then started to play with the number. I would leave early to get a lower number or stay later to get a higher one at the end of the day. Sometimes I would guess my number before I got to the bridge and then check how close I was. Numbers are fun for nerds.
I began to have a feel for the days. Most, it seemed, peaked at about 1,500 in August. As fall approached and the rain started, the numbers got a bit lower. I would find myself in the 400s or 300s in the morning. By November there were days I was in the 300s coming home.
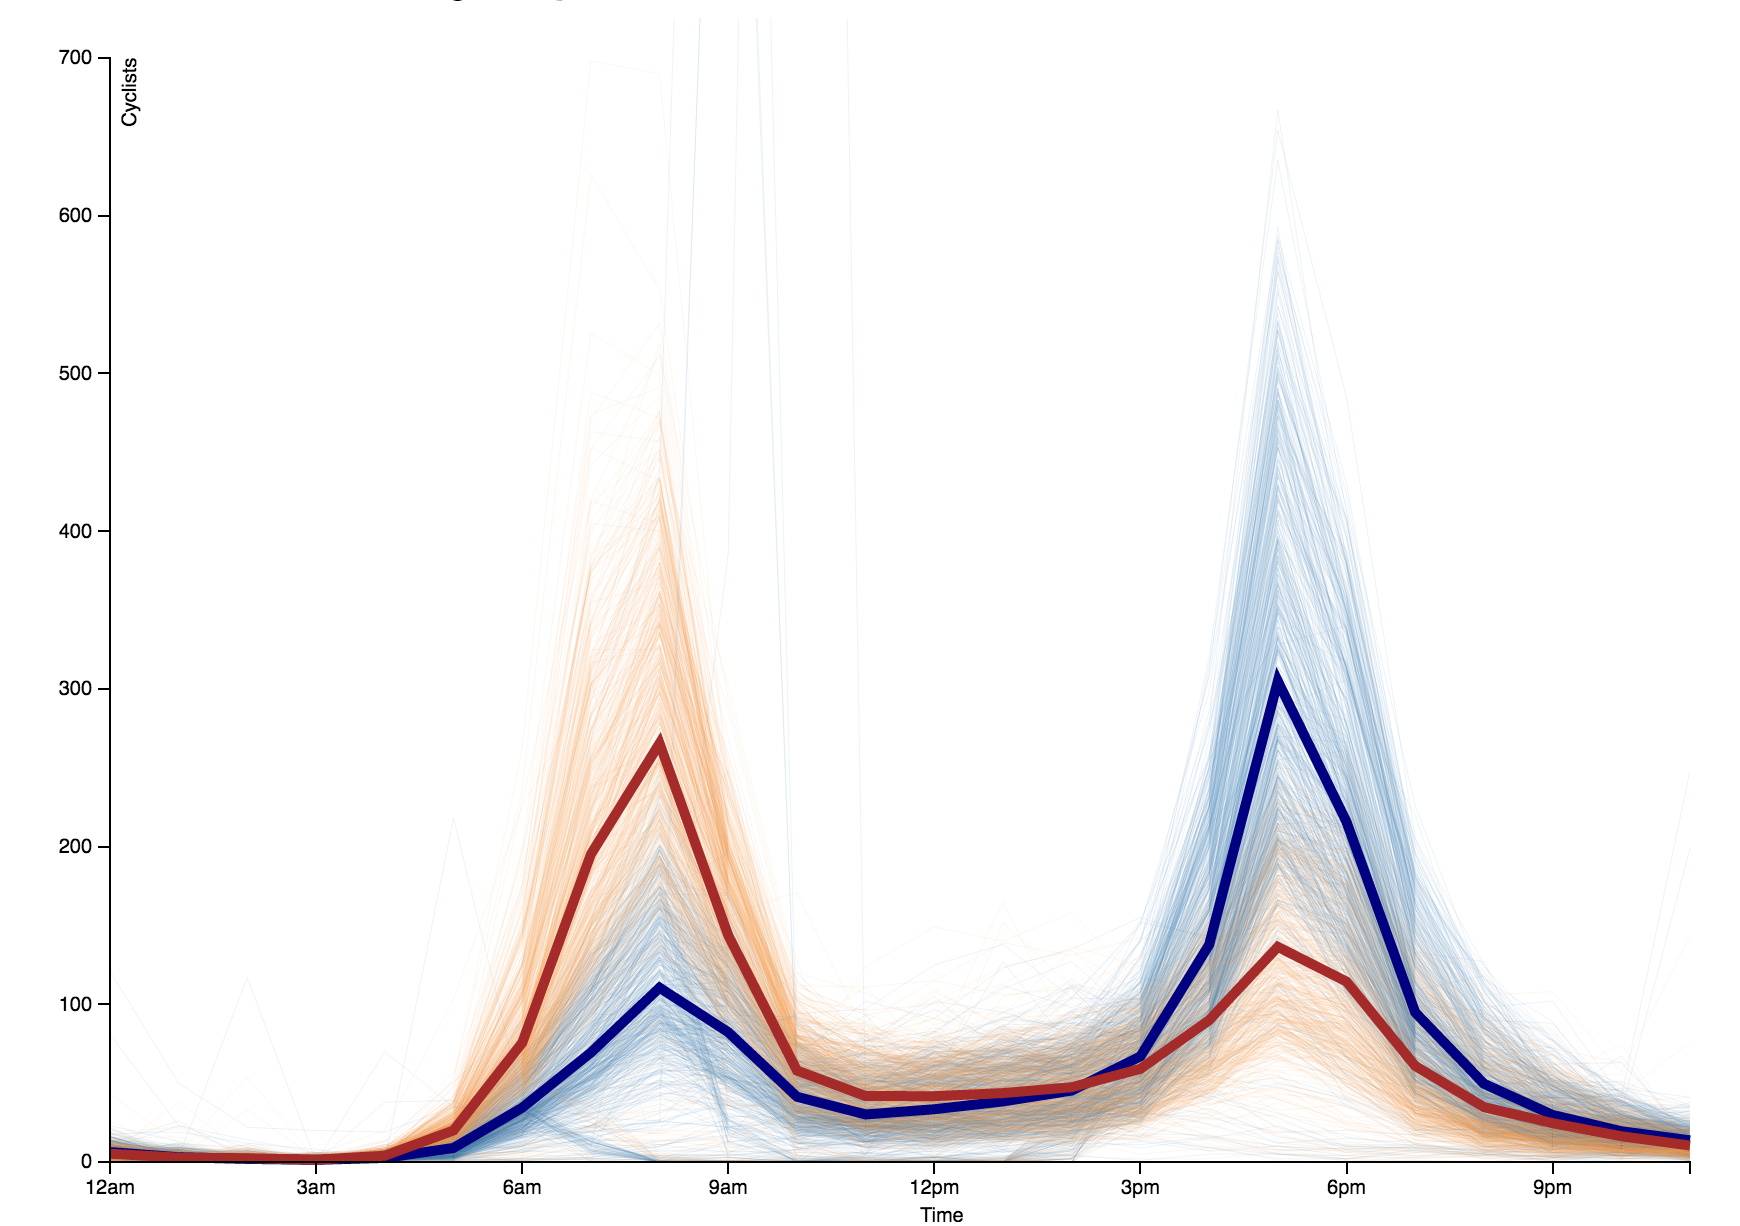
Like me, there were lots of people that had a hard time biking when the weather was bad, the numbers made that clear. I’ll show you (because it wouldn’t be a Greg post without some charts. Note that this data is actually from another bike counter, not the one I pass, so the numbers are a bit different.
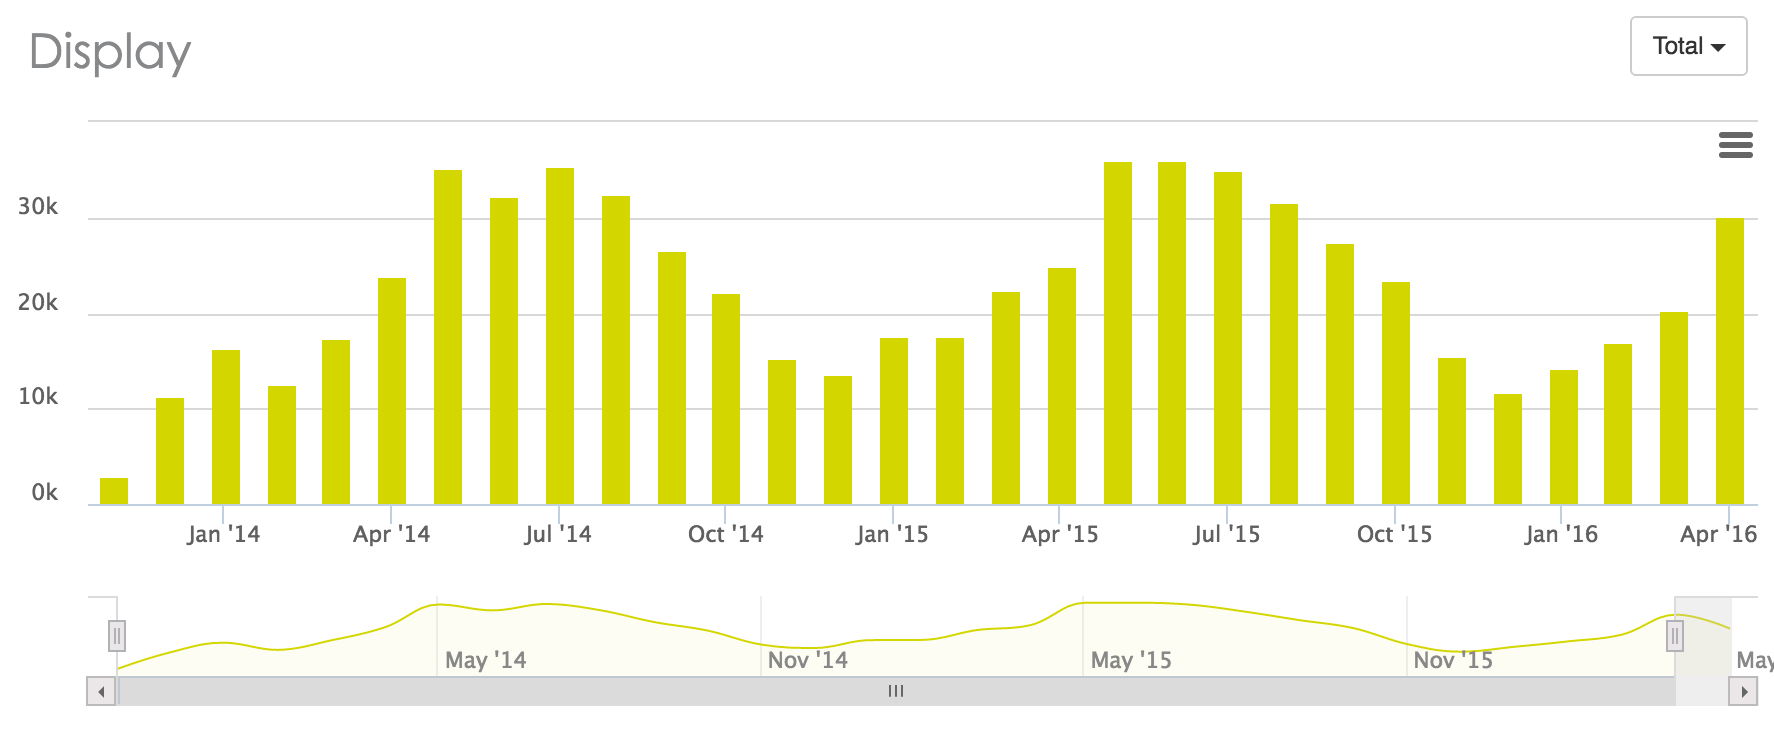
Generally, there is just a lot of seasonality. The winter months see about 50% of the traffic of summer months.
Per day, the variance is even greater though. Lets compare nice days to miserable days.
Here is the aggregate data from nice days, over 80 degrees, with no rain. You can see it peaks going in to the city at 8am at around 400 and peaks going out of the city at 5pm at around 500.
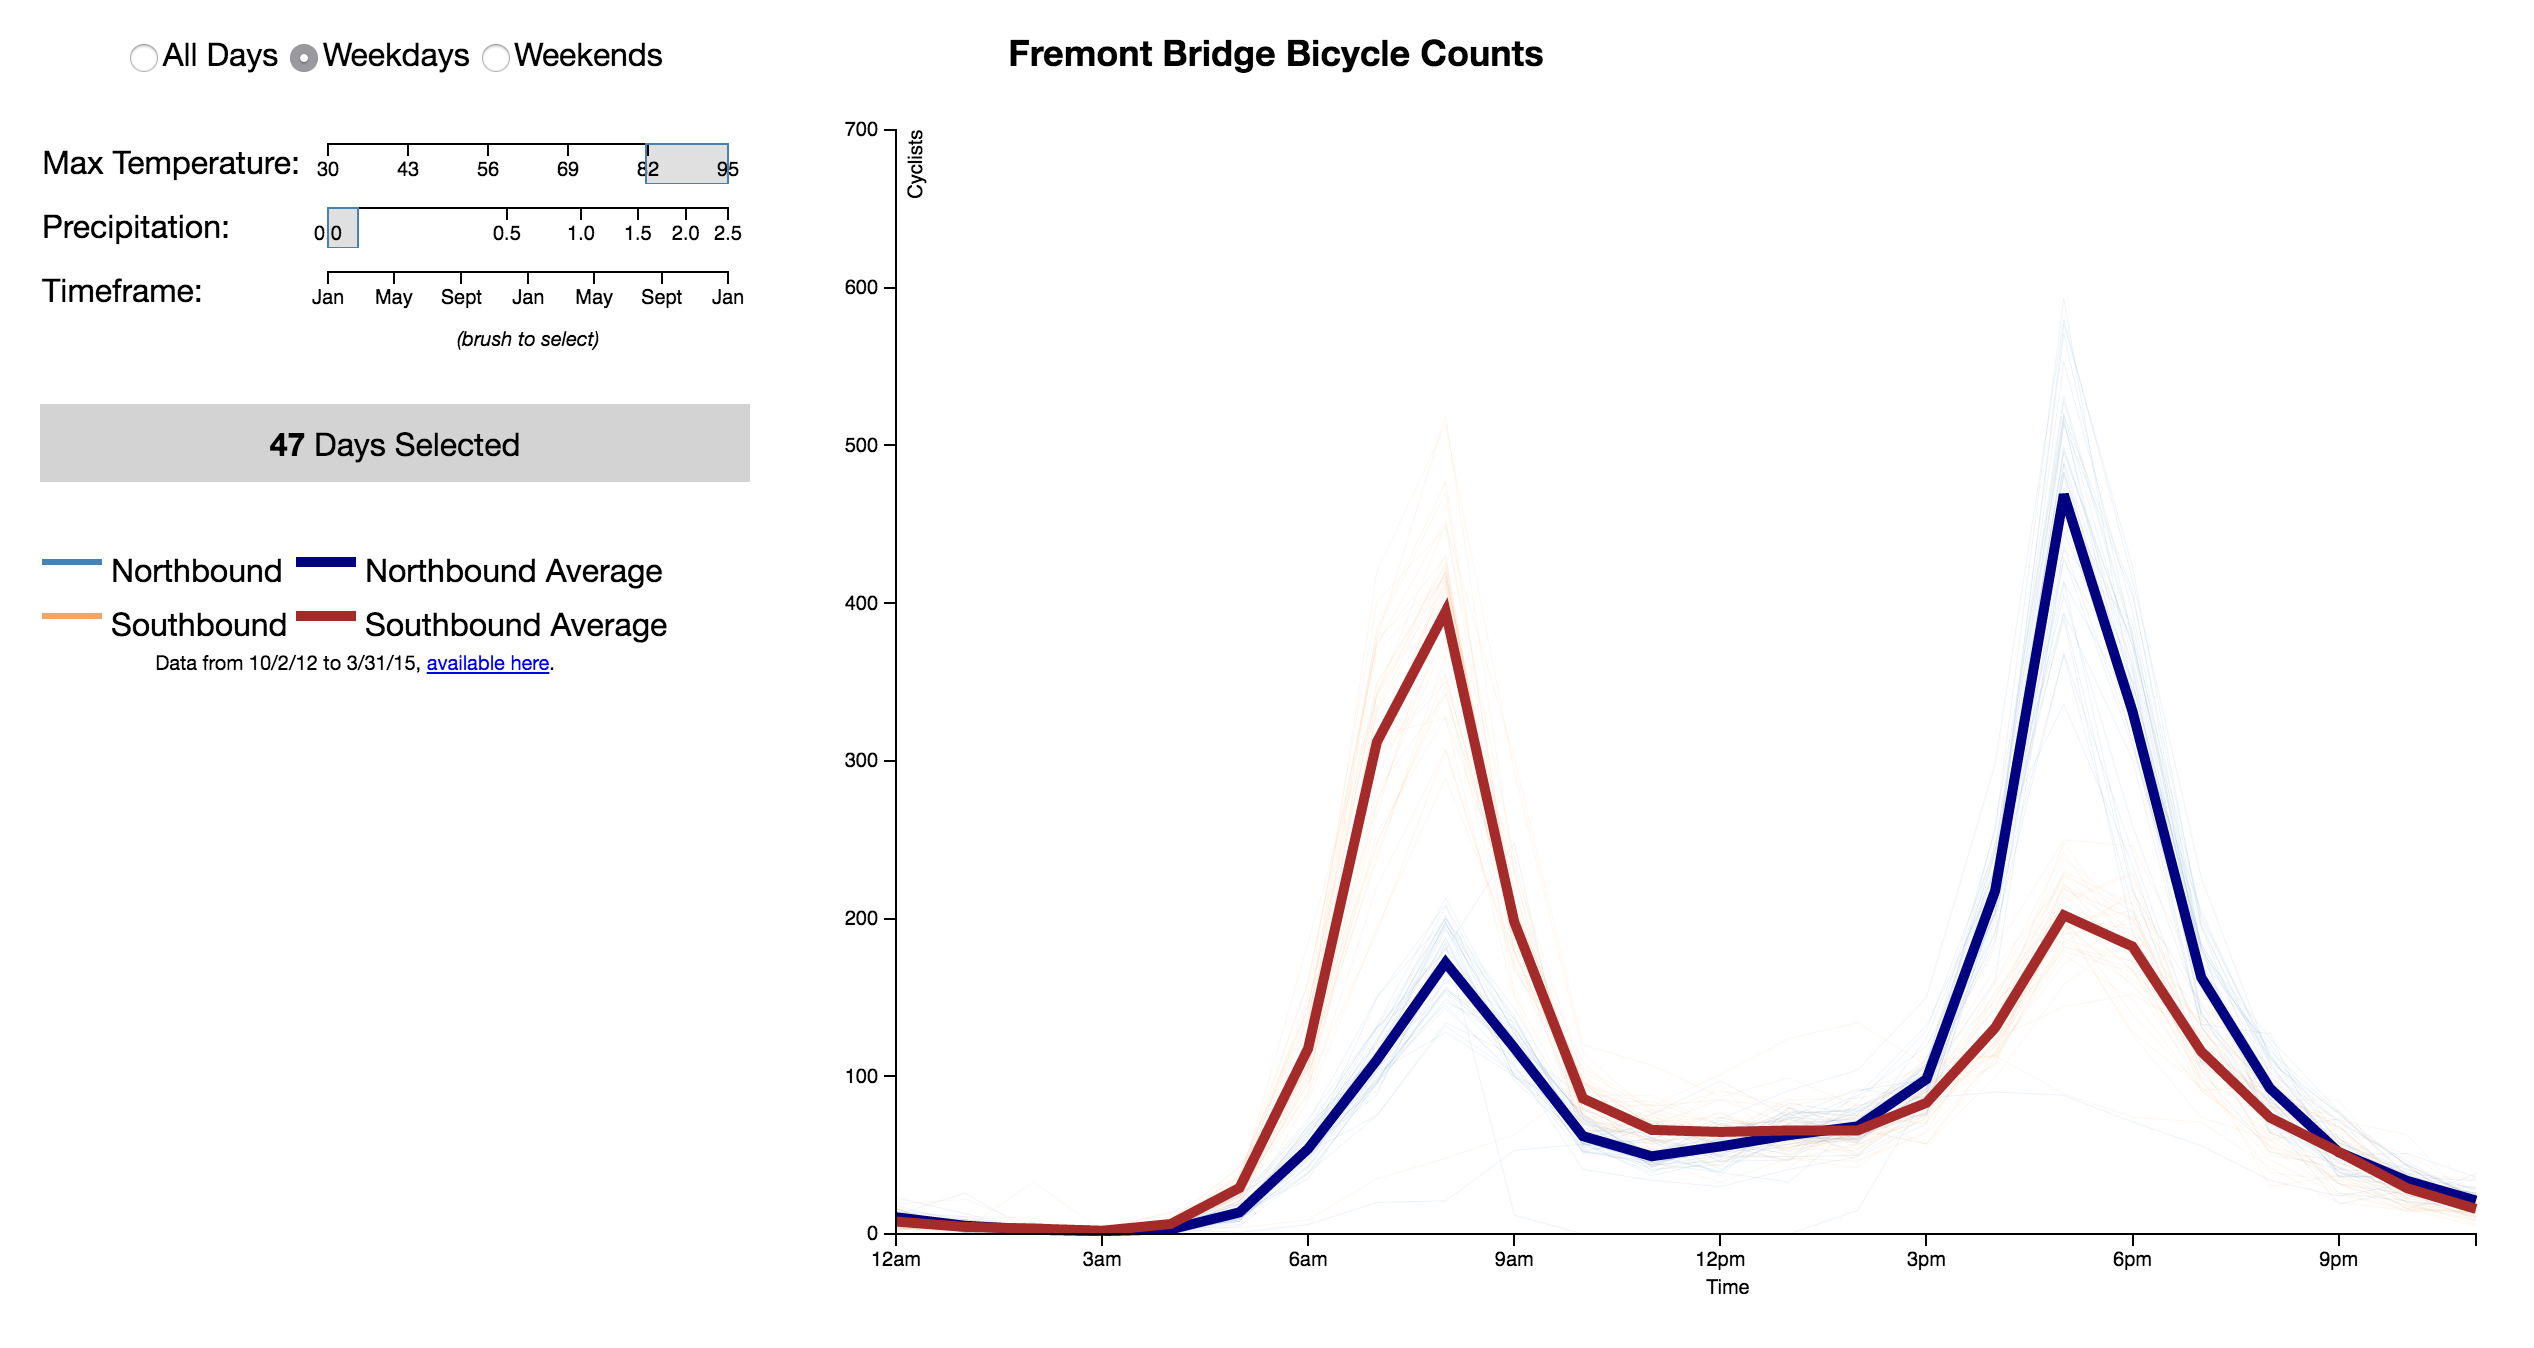
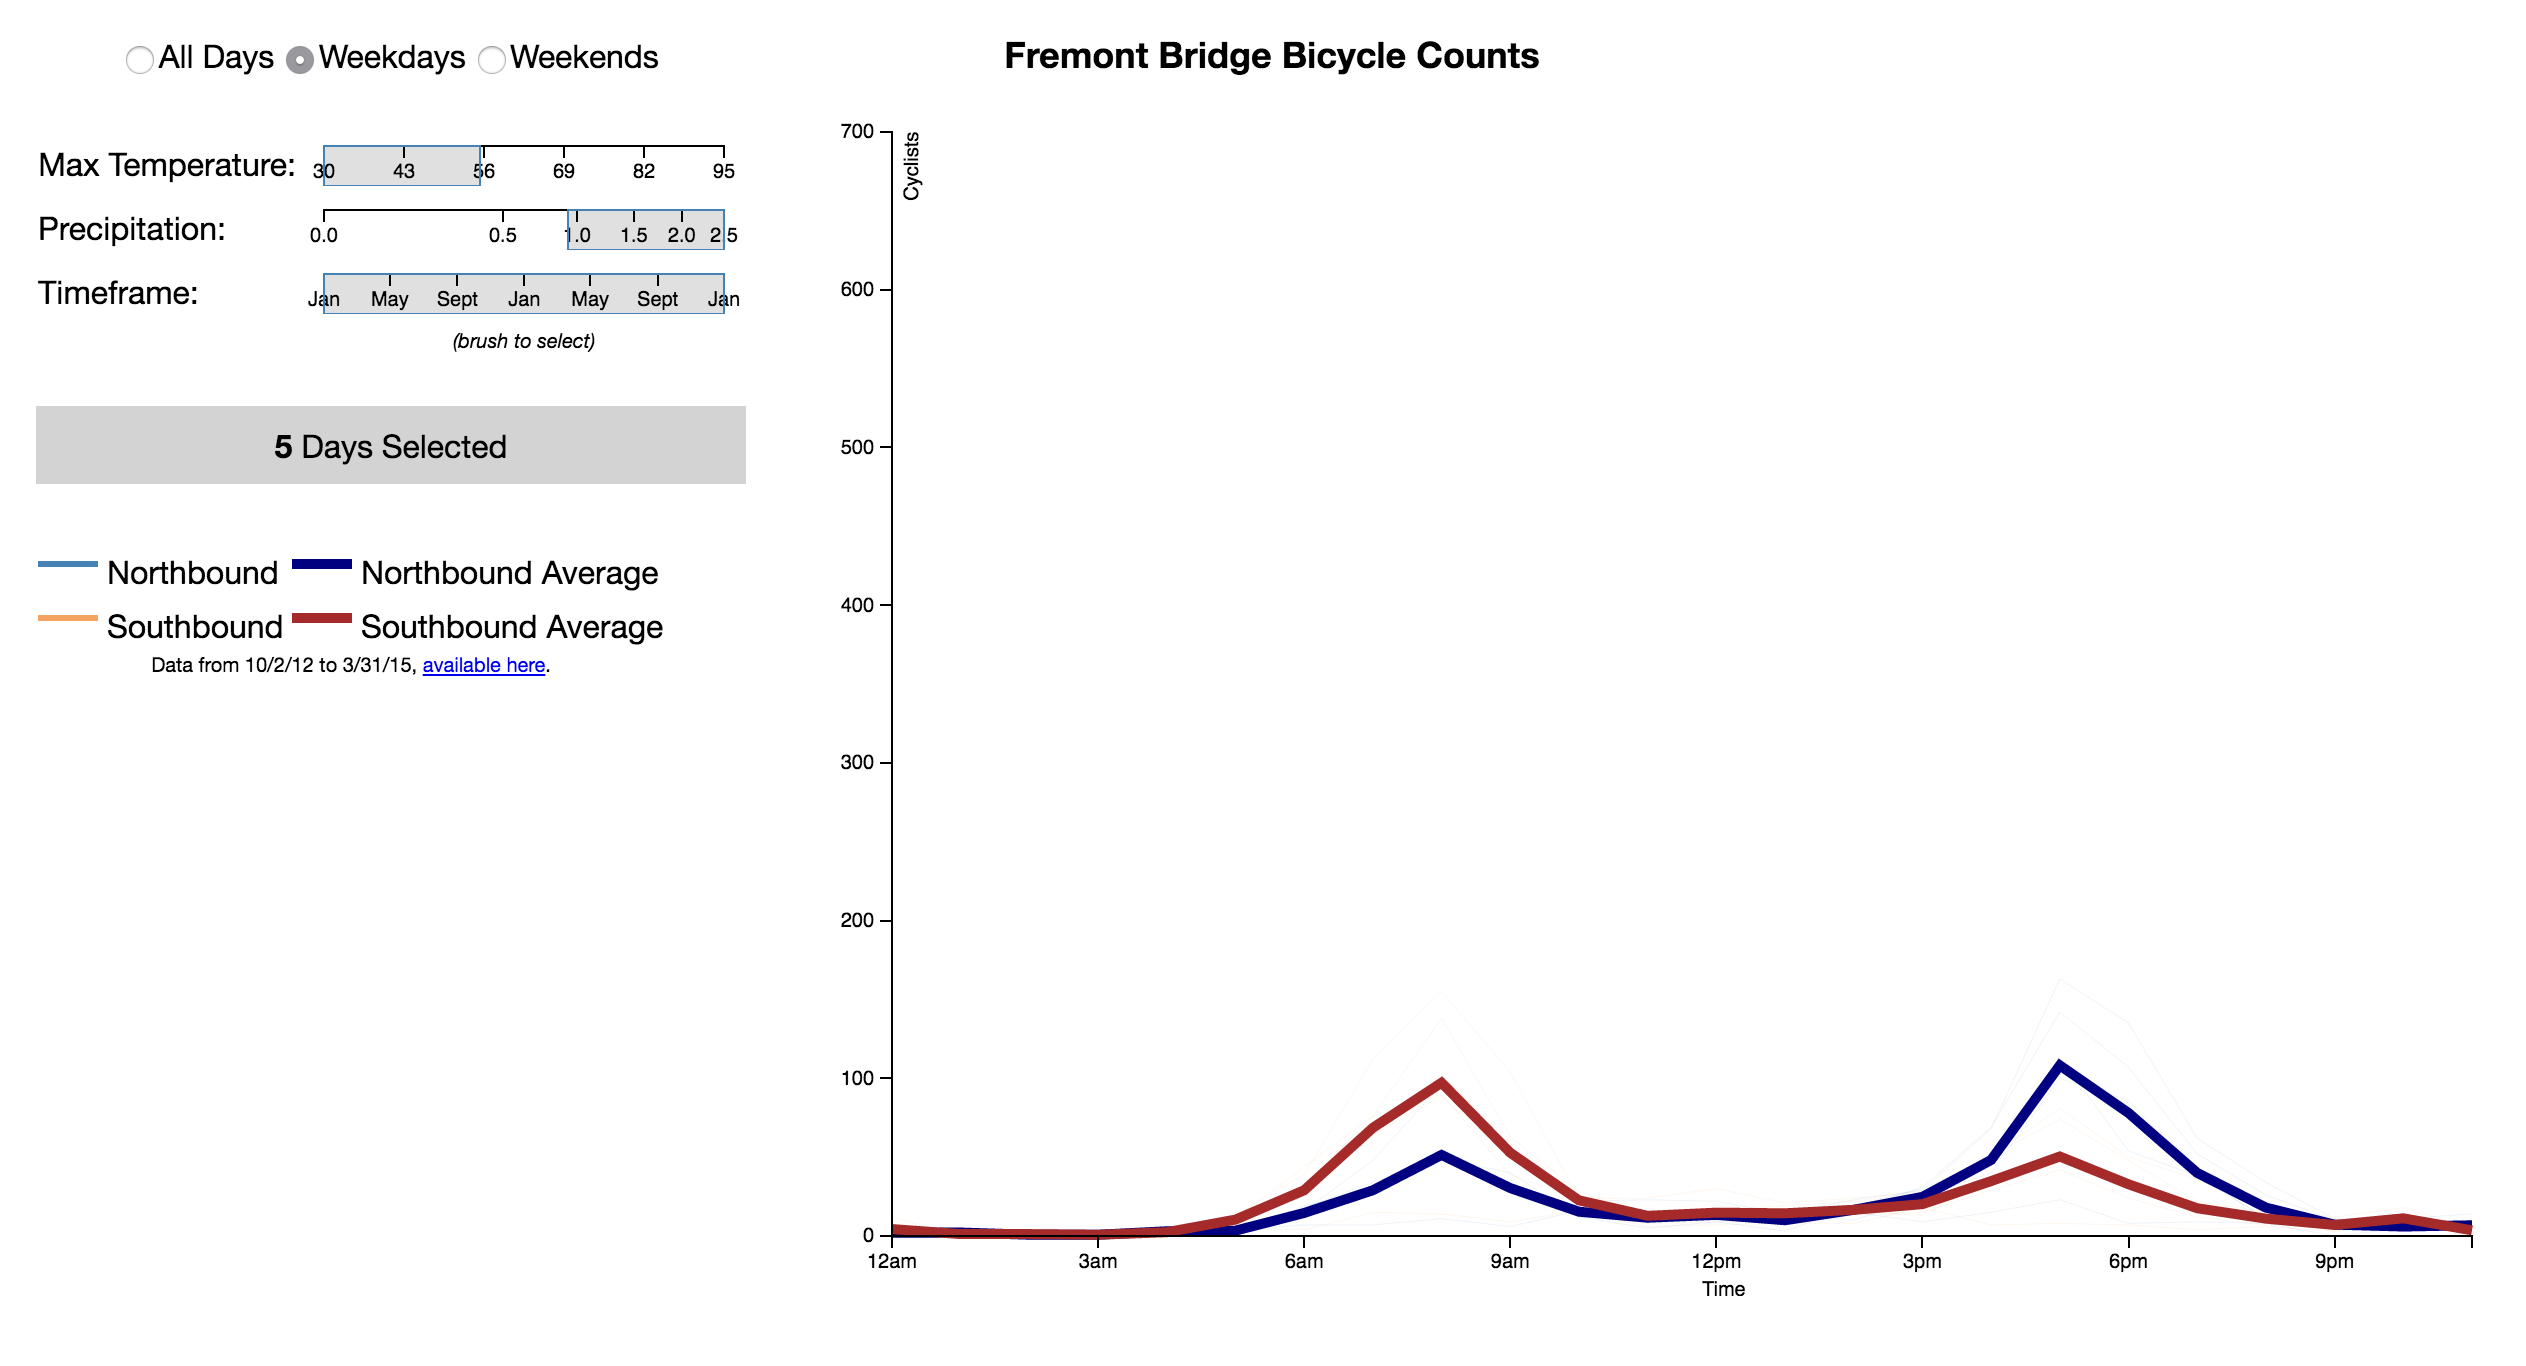
Here is the aggregate for days where it rained more than an inch and was colder than 50 degrees. Note the n is pretty low here – only 5 days met this description. Nonetheless, the effect is visible, the peaks are at about 100, only 20-25% that of nicer days. Huge variance based on weather.
This is where things get interesting for me.
My HTFU Score
I frequently talk about how challenges make you stronger. One way to measure how challenging something is, is to consider how many people are able to and chose to do it. Often it is true that the fewer the number, the harder the challenge, and thus the stronger you must be to complete it.
It is under this mentality that the statement “you’re crazy” is one of the highest compliments in my book. It means you’re an outlier at something you chose to spend your time accomplishing. You are of a select group, of small count, that was strong enough, dedicated enough & innovative enough to do it.
So when the weather got worse and the number on the bike counter got lower, I began to look at that number as a score of sorts. The lower it was, the fewer the people willing to make the commute, the more elite a group I was placing myself in.
There is an acronym in biking I write about sometimes. HTFU. It stands for harden the f-word up. Generally it means that whatever your excuse is, isn’t good enough. Get out there and do it.
While it stinks of machismo and arrogance, it stands in stark contrast to the accusations of entitlement and laziness too frequently cast on my generation. We’re out there biking. Are you still polluting and hoping someone is going to fix it for you?
The number on the bike counter has become my HTFU score. Seeing a low number means I got up earlier, toughed it through the weather, rose above the excuse. It is the numeric representation of my ability to become stronger in the face of a challenge.
I still don’t bike every day. There are still days where I am too tired, too sore from a run or just unwilling to deal with the weather. But on days when I don’t, when I give in and take the bus or an Uber, I know that counter is still there, its green lights showing a score I won’t get. That is what motivates me to try harder the next day.
Hi,
Just a quick remark on this otherwise very good and interesting post, sensors are not lasers at ankle height, but inductive loops burried in the ground detecting the metal of bicycle wheels!
Thanks!
Good to know. I’ve updated the post
Greg,
What is your commute distance now in Seattle? Just curious.
7.7 Miles. Takes about 40 minutes at a non-sweaty effort. The first half being a straight shot with nice bike lanes and the latter half being city riding.