Innovation Session: My Fantasy Football Auction Draft – Retrospective
Last August, before fantasy football season started, I came up with a strategy to approach the auction draft my work league was having. My season is now over, I didn’t make the playoffs, so I want to take a look back at that strategy to see what I can learn. The important part of this analysis is figuring out how much of my poor performance I should attribute to my draft strategy and how much to other factors.
Streaming Defenses & Kickers
The first thing I want to evaluate is my decision to ignore defenses & kickers in the draft. I instead focused my draft strategy around skill players; QB, RB, WR & TE. I did this because I planned to employ a method called streaming. This involves picking up and playing people based on their match-up each week instead of relying on one team.
Over the 13 week season I played 8 different defenses. My total score for defenses was 281.6, an average of 21.6 points per week. (FYI – We have crazy defensive scoring) That would be the #10 ranking defense in the league – after accounting for bye weeks. The #2 defense averaged 24.97 points per week though, so the difference is negligible.
Going forward, I’ll continue to stream defenses. As I get better at it I might even be able to beat single team scores, I noticed that most weeks one of the top three highest scoring teams was available. The maximum possible streaming score was much higher than the maximum possible single team score.
Over the same 13 weeks I played 6 kickers. My total score was 85 which would be the #28 ranking kicker. There were only 6 that did worse. This clearly wasn’t the right way to go. However, the difference between my score and the first place kicker was 4.5 points per week so this isn’t horrible, but certainly didn’t help.
I think next year, I’ll avoid streaming and instead focus on grabbing a kicker from a high scoring team and sticking with them. That seems to pay off more and offer more predictability.
Auction Draft Strategy
Now that I have some insight into my decision about drafting for the D & K positions I can evaluate my approach to drafting skill players.
The strategy I employed was to optimize for value. I wanted to get the most points for each fake dollar I spent. I based this strategy on the idea that players are interchangeable commodities and that it was better to avoid hyped and price inflated stars and to instead grab people that were undervalued. I had hoped that most teams would draft a few stars and then only have enough money remaining to scrape the bottom of the barrel, leaving me to grab a team full of upper-middle tier players.
To state this mathematically, I thought most teams would consist of 10s & 1s, for an average around 5-6, while I’d have a lot of 6s & 7s, for an average of 6-7, thus a slightly better team overall.
Predicting Production
To figure out value I used some projections that football experts had put together about how many points each player would score during the season.
After the draft I evaluated my team based on the projections I used. I compared what was paid in the auction with the pre-draft valuations I was working off of. It looked like I had crushed it. In the table below, positive numbers represent overpaying and negative numbers represent underpaying.
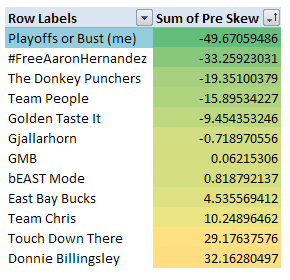
I had gotten 25% (~$50 of $200) more team than I should have and if my numbers were right that should have resulted in an awesome team.
The major flaw in this system is that it is heavily dependent on the accuracy of the projections I used. In a world where those were mostly correct, I would have fared well. Reality however is very hard to predict.
Actual Production
Now that the regular season is over and I have actual point values, I reevaluated the draft using the actual production of players rather than their projected stats. The second column compares the price paid by each team with their actual season production.
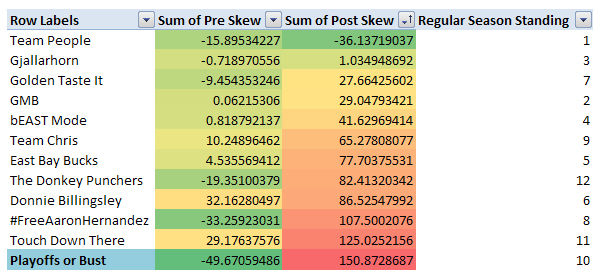
It turns out that my draft was basically a waste – $150 of the $200 fake money I spent did not help me. I of course generally knew this, having suffered through the season, but it is interesting to see the exact figures.
What Went Wrong?
I would love a simple explanation. To be able to say that based on those results, my draft strategy didn’t work and I should not try it again. Unfortunately, a single season of football doesn’t have enough data to evaluate a strategy to an acceptable level of significance.
Fantasy football has the rare ability combine a low sample size with high variability. Football is contact sport that creates often unpredictable injuries & this season was particularly injury heavy, especially for high profile skill players. Injuries can and do happen to anyone.
Thinking About Risk
This leaves me speculating whether the players I drafted were available for value because people knew they would get injured or if I just got a run of bad luck.
Qualitatively I can see in retrospect that I had a risk heavy team:
- Rob Gronkowski – Started the season injured and missed the first half
- Darren McFadden – Has been injured every year of his career
- Steven Jackson – A RB over the age of 30
- Roddy White – Missed pre-season games due to an ankle injury
- Dwayne Bowe – New QB & coach & no pre-season indications of heavy use
Often predictions will take this into account, but the consensus stats I used were only concerned with averages, not standard deviation. In the future I would be wise to account for that as well, and probably to come up with a few additional risk factors to account for. When drafting, risk is a fine thing, as long as it is balanced with some stability.
Risk By Position
As I think about risk, one factor that I have data on now is risk by position. We can take a look at this season and see how each position played out.
The chart below shows skill positions and how the drafted players in my league on average lived up to pre-season expectations.
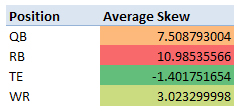
We can see that RBs & QBs really dropped the ball this year. Of course, this won’t come as any surprise to anyone that drafted CJ Spiller, Ray Rice, Doug Martin, Trent Richardson or Arian Foster. In fact, Matt Forte & Demarco Murray were the only RBs, of the 24 with the highest draft price in my league, that performed better than their draft price would indicate.
Meanwhile TE was a gold mine. On average every dollar spent there paid handsomely. Especially Jimmy Graham.
I need a few more seasons of data to see if these are conclusive results. But, common fantasy football knowledge defends that RBs are more injury prone though which turned out to be true this year. If that remains true, what it means for future seasons is that drafting high on WRs will have more lasting value on average. RBs will always be available on the waiver wire as the season progresses and injuries occur.
Risk by Team
I also plotted the difference in actual to expected performance by team to see if there were any trends there.
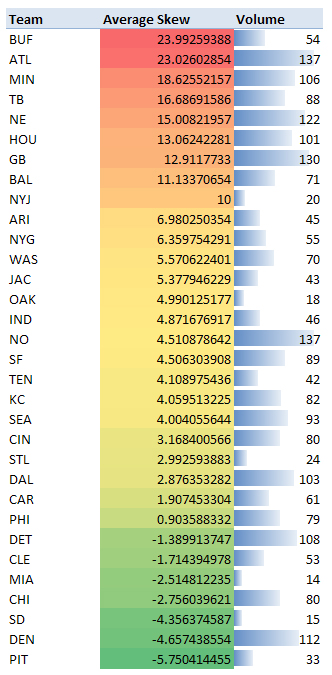
The two that panned out the worst were Buffalo & Atlanta. Buffalo because of CJ Spiller who was the only drafted player. Atlanta because of the complete meltdown that team saw including injuries of Roddy White, Julio Jones & Steven Jackson (which resulted in a poor season for Matt Ryan).
From what I can tell, looking at a player’s team isn’t a great indicator of success. Neither the team’s win/loss record or their improvement over expectations seems strongly correlated with the success of the fantasy players on the team. Examples include Denver who was an early favorite, but has done even better than expected, Cleveland who is 4-8, but has had a few players pan out, and finally Kansas City who has turned their team from #32 to #2, but not to the benefit of many fantasy owners.
Methodology Criticisms
The methodology I used to do this analysis has some flaws that are worth noting. I made the trade off of using a less rich analysis so that I could complete it faster.
The figures I analyzed are based off of the total points a player scored during the season. I have not taken into account the week to week scores. This creates a few edge cases and masks the true value of certain individuals. For example, players that performed well up until an injury will appear undervalued and players that were inconsistent might appear overvalued.
Thinking about injuries, Aaron Rodgers for example had a great season through week 8. He sustained an injury in week 9 and hasn’t played since. In reality he would have been a fine QB with high value during the first 8 games. I have yet to take this into account and it is worth noting in future analysis.
Looking at consistency, a player like Dwane Bowe who was likely overvalued in my analysis. In Bowe’s first five weeks he scored; 3, 11.6, 0.4, 11.8, 3.5. That level of variance was incredibly frustrating for a fantasy player. In my analysis I would have valued him the same as a player that got 6 points every week. In reality they are much different. In the future I would like to take this into account. (This might value RBs a bit higher as they tend to be more consistent where as WRs can see high variance due to big plays and TDs.
This year I based my projected values strictly off of projected points, optimizing for maximum points throughout the season. Knowing what I know now, next year I want to incorporate more with consistency ratings. I have realized that the worst thing is not a low scoring player, but a player who brings high and low scores at unpredictable times.
2 thoughts on “Innovation Session: My Fantasy Football Auction Draft – Retrospective”