Innovation Session: The History of NFL Win Percentages
Tonight I’m going to start working on an idea I had for an interactive chart of NFL win percentages. The idea came to me when thinking about the Detroit Lions and how bad they are. I wondered if they had always been this bad or if it was only recently. (Hint: Always) So I thought it would be cool if I could look and see every team’s win percentage for each NFL season going back in time.
This would be something easy to do in Excel or a static charting library, but I’m going to use it as an excuse to play with/learn an interactive data visualization library called D3.js. This is the javascript library that drives many of the webs coolest visualizations, like this New York times feature on NBA shot percentages.
I’ll have to get it working first, but once I do I’ll be able to add interaction and highlighting to make it easier to spot trends. I’m really excited about this… but that is because I haven’t started writing any javascript yet, once I do I’m sure my tone will turn more to frustration, it usually does when javascript is involved.
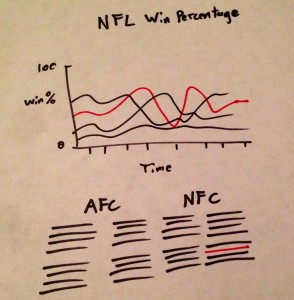
Here is a 30 second sketch of what I am thinking. Lots of lines, the ability to make one stand out and some sort of grouping of teams so it is easy to turn them on and off.
Getting Started
I going to start with the javascript and worry about data later. That is the easy part. Code will be posted on my github.
This is my first project running D3 from my server and also my first time developing on a local web server and then pushing the code to my regular server through github so I’m bracing for the unexpected.
A few minutes later… that was actually pretty easy. The nice part of developing an interactive visualization like this and pushing commits each time I get it working is that I can rewind if I ever need to.
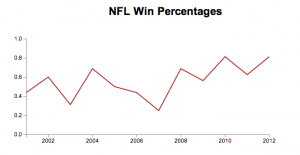
Tonight I walked through a tutorial to get a basic line chart working in D3. The data is all loaded from a separate file which is the main goal. As I update the data in that file, the chart will update. I might explore loading data from an sports data API at some point, but for now this seems like one less level of complexity. As of tonight, what I’ve finished looks like this.
It is the last 12 season of the Atlanta Falcons. I figured that was a good place to start.
If you visit this page in the next week or so, you’ll be able to see something that looks like that live (assuming nothing breaks). If you wait longer then a week though it might look different. Because this graphic is D3, it is rendered live when you visit the URL. S0, once I start working on it again, the version you will see at that link will be the most up to date one and it might be very different.


One thought on “Innovation Session: The History of NFL Win Percentages”