Boardgames & Math – Pass the Pigs – Part 2

This week I’m going to pick off where I left off last week – analyzing the game Pass the Pigs. If you haven’t read last week’s post yet, you should do that first here.
At this point, we’re going to switch from solving algebraically to doing a bit of programming. All of the code I’m using can be found here – feel free to fork it and play along.
Threshold Simulation
Right off the bat – I’m going to check if last week’s conclusion is correct by running a simulation of the different risk thresholds. What we concluded was that once you were above 18 points your rolls would be risking more than their potential reward. In the chart below the x axis represents the risk threshold of the player, how many points they are comfortable accruing each round before passing, and the boxplot represents the results they have after 1,000 simulations. You can generate this graph for yourself by running the run_threshold_simulation() function.
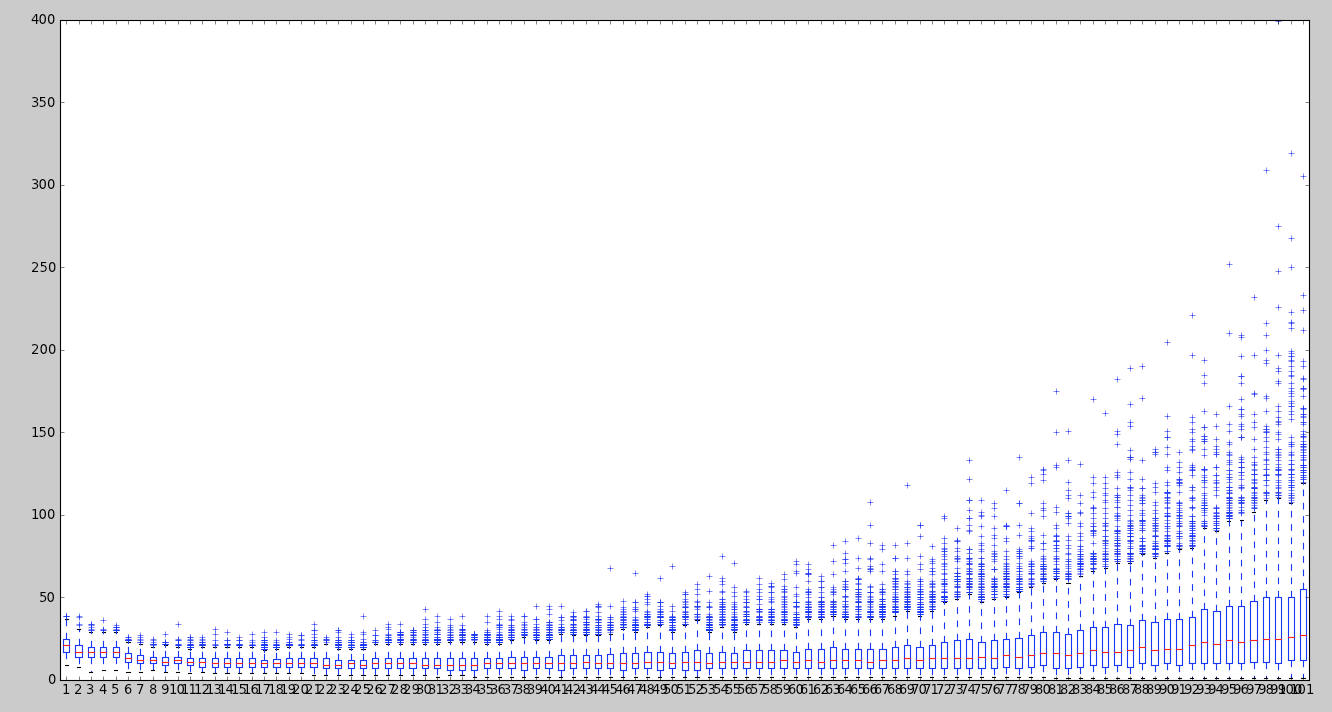
A few things I noticed:
- Having a risk threshold of 1 doesn’t mean your quickest game will be 100 turns. Since your first roll could return 5, 20 or even 60 points, this threshold actually finished before 50 turns most of the time.
- There is a performance increase when moving from 1 to about 10 as a threshold and then things stay fairly steady until after about 60.
- The low end continues to decrease as your threshold increases. This is expected. Unless you have a threshold somewhere near 100, it is nearly impossible to finish in one turn. Of course…
- The high end dramatically increases as your risk threshold increases. If you put a few points in the bank every turn, even a low risk player will finish in ~25-50 turns. If you play high risk, you could go hundreds of turns before finishing.
There doesn’t seem to be much difference in the results of players with thresholds between 10 -50. I want to find out just how close those players are so I’m going to write a function to have two players go head to head to see who wins.
Strategy Comparison
We’re going to compare 100 strategies to each other and simulate each comparison 1,000 times. That is about 10MM games of Pass the Pigs my computer will be running. Guinness world record evaluators, please take note, I doubt anyone else has ever played this much Pass the Pigs.
If you’re playing along at home, you can run run_strategy_comparison_simulation() to make this chart – be warned, it may take a while.

What we are looking at is the chance that I will win a game if my strategy is the number of the Y axis and my opponent’s is the strategy on the X axis. Green means I’m more likely to win – Red means they are more likely to win. The stronger the color – the more of a chance. A few things I notice:
- There is a hard line at 5 which extends out in either direction and anything inside 5×5 is a bit different. This makes sense because if you remember from last week – the chance of getting a ‘pig-out’ is ~20%.
- There is a nice bit of symmetry.
- There is a yellow diagonal going from top left to bottom right – these are the scenarios where I play someone with the same strategy I am using.
- There is another curving from the lower left to the top right. These are situations where the low & high thresholds return similar results.
- If I play a strategy with a threshold between 20-25, there are no strategies I can encounter that give me a <50% chance of winning. I would remain in favorable or neutral ground against all competitors.
- The left side green area is actually a bit bigger than the top red one – same with the other red & green spaces. What this actually means is that there is an advantage to going first.
- Most of this grid is made up of situation with even odds or +- 20% at most. This means Pass the Pigs is largely a game of chance
Digging deeper – the optimal threshold turns out to be 23 – which gives me a 65% chance of winning against a random opponent. We know that we will not likely be playing with someone on one of the extremes though – and so our chances of winning will likely be in the 50-55% range. That is slightly better than even money.
I did some research and a few people smarter than me have tried to solve Pass the Pigs using more complex methods and their resulting algorithm gives them a few points on top of the odds we saw. What we accomplished here is pretty close though.
Back to Our Goal
I want to make sure we are keeping our eye on the original goal: helping me win Pass the Pigs. This is an important lesson – making sure to always loop back to the original goal instead of solving for a proxy goal.
Our goal isn’t solely to come up with an optimal strategy to Pass the Pigs – our goal is to win. Playing optimally could help us to win – but isn’t the only way to win.
Another approach we can take is to introduce change to the game to make it more favorable for us given our skill, knowledge, circumstance, etc. House rules if you will.
What we would want to do is look for rules we could create that would introduce pockets of favor to the game and then take advantage of those before our competitors become aware of them or are able to adapt.
For Pass the Pigs our strength right now is our understanding of the probabilities of the pigs and our ability to make mathematical decisions. Currently our precise decisions only offer a slight advantage over gut decisions. What we could do is introduce more situations where making an accurate judgement call would affect the game outcome. Perhaps a different endgame or some sort of side bets.
That will have to wait for another time though.
One thought on “Boardgames & Math – Pass the Pigs – Part 2”